


I live for events that rock the market because its a great time to buy in on the cheap.
Anyone here think that the QQQ, Nasdaq or the Markets are going to go down forever and stay down? No? Then why are you freaking out and selling? Instead you should be watching the market and looking for a new in to make an additional purchase. If you sell now, then you are buying high and selling low and are reacting with the panicking crowd and have no business being in the market.
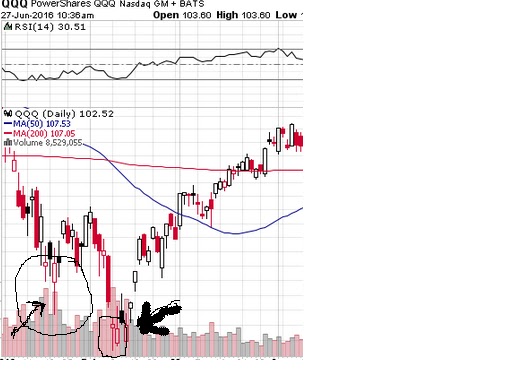
This is how you are going to play this: First go to stockcharts.com and take a look when there were other drops and look at what the candles did when a bottom was reached:

If you look at the candles themselves where each day represents a candle, the days that I circled you will notice that two of the candles have very long bottom tails. This signifies a bottom. Why is this? Lets look at the actual mechanics of a bottom candle. If the candle is white, this means that the bottom part of the actual thick body of the candle is the open, and the thick part of the top of the candle is the close price. So during the day the price flucutated between these two points to create the candle:

Now if a candle has a tail on the top or the bottom this is the lowest price of the day or the highest price of the day beyond the opening or closing price.
When you get a candle that has a long bottom tail, this means that investors had begun to panic, the price has reached very low, AND WAS UNABLE TO SUSTAIN THAT LOW PRICE DUE TO BUYING PRESSURE: the market saw that this was underpriced, and was purchased right back up again. This is a bottom, where investors were not going to let this go lower due to its perceived value. When you have a candle with a low bottom tail like in the two points I circled, watch what then happens over the course of the next week...recovery.
This is what I am looking for with the brexit situation. The markets panicked which is a great opportunity to go ahead and use this bottom signal, whenever it may occur. Check out Fridays candle which is an opposite to a bottom candle:

I knew from looking at this candle that there would be a further drop. The candle had a big upper tail which was investors buying trying to recover with the price reaching way up, snapping back and failing with investors retreating. This shows that there is more downside potential, such as today.
I will be watching today very carefully. I am looking for a big bottom tail. Might not come today, could take several days to consolidate. But I am in a great position, sitting here with a pile of money waiting for blood in the streets to get in and buy. Like the real estate crash of '08, or the market crash of 2000.
Tradinginsider
Anyone here think that the QQQ, Nasdaq or the Markets are going to go down forever and stay down? No? Then why are you freaking out and selling? Instead you should be watching the market and looking for a new in to make an additional purchase. If you sell now, then you are buying high and selling low and are reacting with the panicking crowd and have no business being in the market.
This is how you are going to play this: First go to stockcharts.com and take a look when there were other drops and look at what the candles did when a bottom was reached:
If you look at the candles themselves where each day represents a candle, the days that I circled you will notice that two of the candles have very long bottom tails. This signifies a bottom. Why is this? Lets look at the actual mechanics of a bottom candle. If the candle is white, this means that the bottom part of the actual thick body of the candle is the open, and the thick part of the top of the candle is the close price. So during the day the price flucutated between these two points to create the candle:

Now if a candle has a tail on the top or the bottom this is the lowest price of the day or the highest price of the day beyond the opening or closing price.
When you get a candle that has a long bottom tail, this means that investors had begun to panic, the price has reached very low, AND WAS UNABLE TO SUSTAIN THAT LOW PRICE DUE TO BUYING PRESSURE: the market saw that this was underpriced, and was purchased right back up again. This is a bottom, where investors were not going to let this go lower due to its perceived value. When you have a candle with a low bottom tail like in the two points I circled, watch what then happens over the course of the next week...recovery.
This is what I am looking for with the brexit situation. The markets panicked which is a great opportunity to go ahead and use this bottom signal, whenever it may occur. Check out Fridays candle which is an opposite to a bottom candle:

I knew from looking at this candle that there would be a further drop. The candle had a big upper tail which was investors buying trying to recover with the price reaching way up, snapping back and failing with investors retreating. This shows that there is more downside potential, such as today.
I will be watching today very carefully. I am looking for a big bottom tail. Might not come today, could take several days to consolidate. But I am in a great position, sitting here with a pile of money waiting for blood in the streets to get in and buy. Like the real estate crash of '08, or the market crash of 2000.
Tradinginsider


